Arguments & Plots

Why do we represent culture as data?

Today’s big question!

But first the readings…

What is “Confabulation in the humanities”?

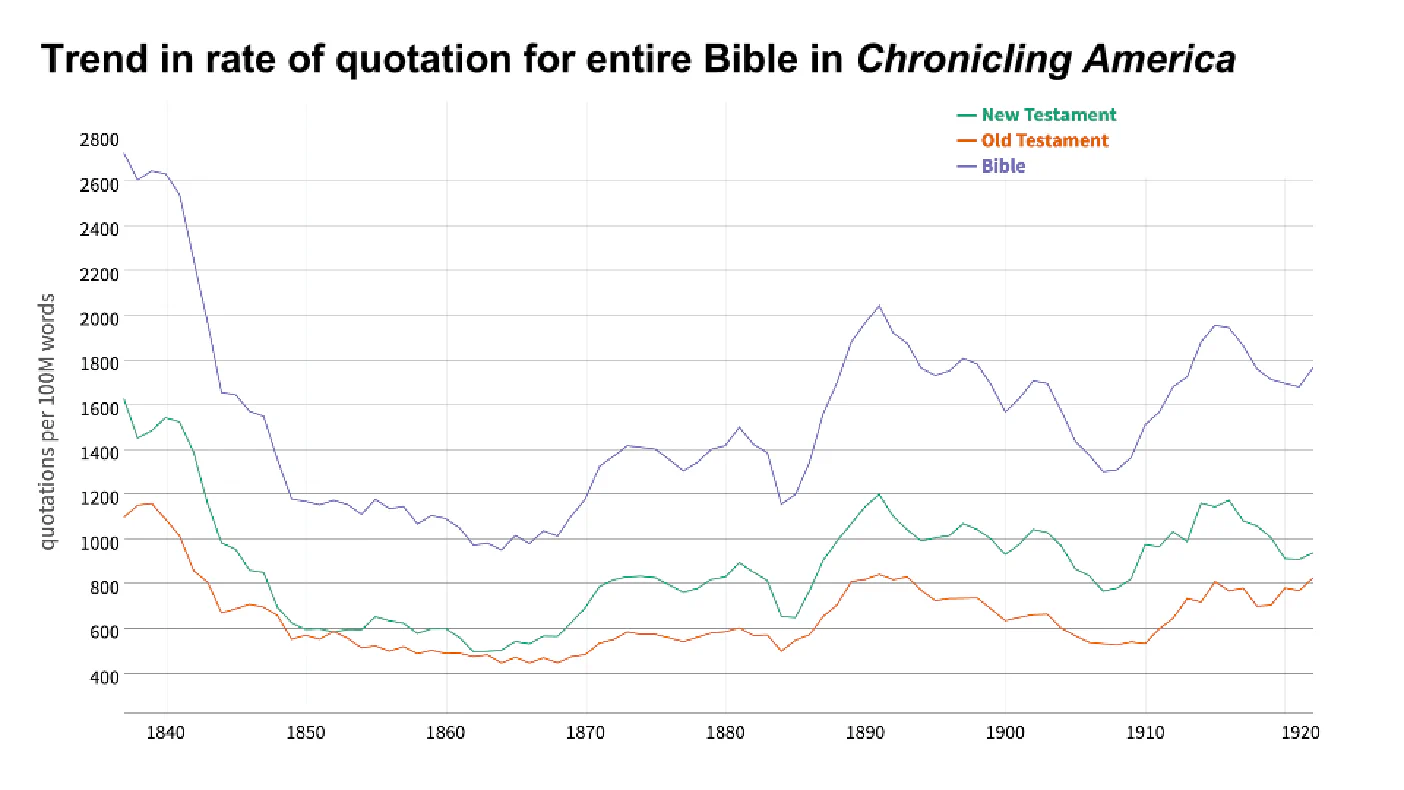
What are these plots of and why are they important for understanding the problem of confabulation?

Why is confabulation a problem for cultural data?

  • What is “ground truth” and how does cultural data differ from other types of data in this regard?
  • How do we avoid confabulation when working with cultural data? What are some strategies for ensuring that our interpretations are grounded in the data?

What is the problem of “Isn’t it obvious?”

Why do some scholars think that digital history can never be new? What does this tell us about the challenges of working with cultural data?

Why do arguments matter for creating cultural data?

  • What is the relationship between arguments and data visualizations?
  • How do they work together to tell stories about culture?
  • What are some of the dangers?

What does it mean to tell stories about culture with data? How does this impact our data creation process?

Storytelling, however, is much more abstract — it’s not merely a technical matter of creating an image of a map, or designing the right chart; rather, it refers to the broader universe of considerations that impact nearly every decision you make in the way you frame and present a project.

How can we repurporse the questions of the Blinderman post for data creation and curation?

  • Who is your audience?
  • Is your focus broad, or narrow?
  • How complex is the idea you’re most excited by after your analysis?
  • Progressing through your argument
  • How did you arrive at your conclusion?

Exploring, Augment, and Analyzing

  • How do these categories relate to the process of working with and creating cultural data?

Let’s take a closer look at the America’s Public Bible Project!

Time to Start Thinking about Your Final Project!

New group assignment that is due week of April 14th and 16th: Critical Computing & Cultural Data